E-commerce Sales and Delivery Analysis
An end-to-end SQL and Python analysis of about 99,000 Brazilian e-commerce orders: cleaning, validated reporting models, business metrics, charts and written findings.
At a glance
- Type
- Data analysis
- Period
- 2026
- Technologies
- Python
- SQL (SQLite)
- pandas
- matplotlib
Purpose
Framed as a scenario in which I act as an analyst supporting an e-commerce operations manager, answering: how sales change over time, which categories and regions contribute most, how order value varies, how often customers buy again, where deliveries run late and how delivery timing relates to review scores.
My contribution
I designed, reviewed and documented this project as a learning portfolio project on a public dataset (the Olist dataset on Kaggle). It has no connection with Olist.
Key features
- A pipeline that rebuilds everything from the raw CSV files with one command: load, profile, clean, model, validate, analyse and chart (the Kaggle CSV files are downloaded separately).
- 41 automated validation checks on key uniqueness, required fields, referential integrity, row counts, money totals and timestamp order. The pipeline stops if any check fails.
- Documented cleaning rules that flag unusual records instead of deleting rows.
- 26 commented analysis queries in 7 SQL files, written with CTEs and window functions.
- Items, payments and reviews aggregated to one row per order before joining, because joining them directly would inflate payment totals by 26.9%.
- Written metric definitions, reported sample sizes and minimum-volume thresholds, with the link between late delivery and review scores worded as an association rather than a cause.
Documented results
Taken from the project’s own findings report. They describe the dataset studied (2016–2018), not the marketplace today.
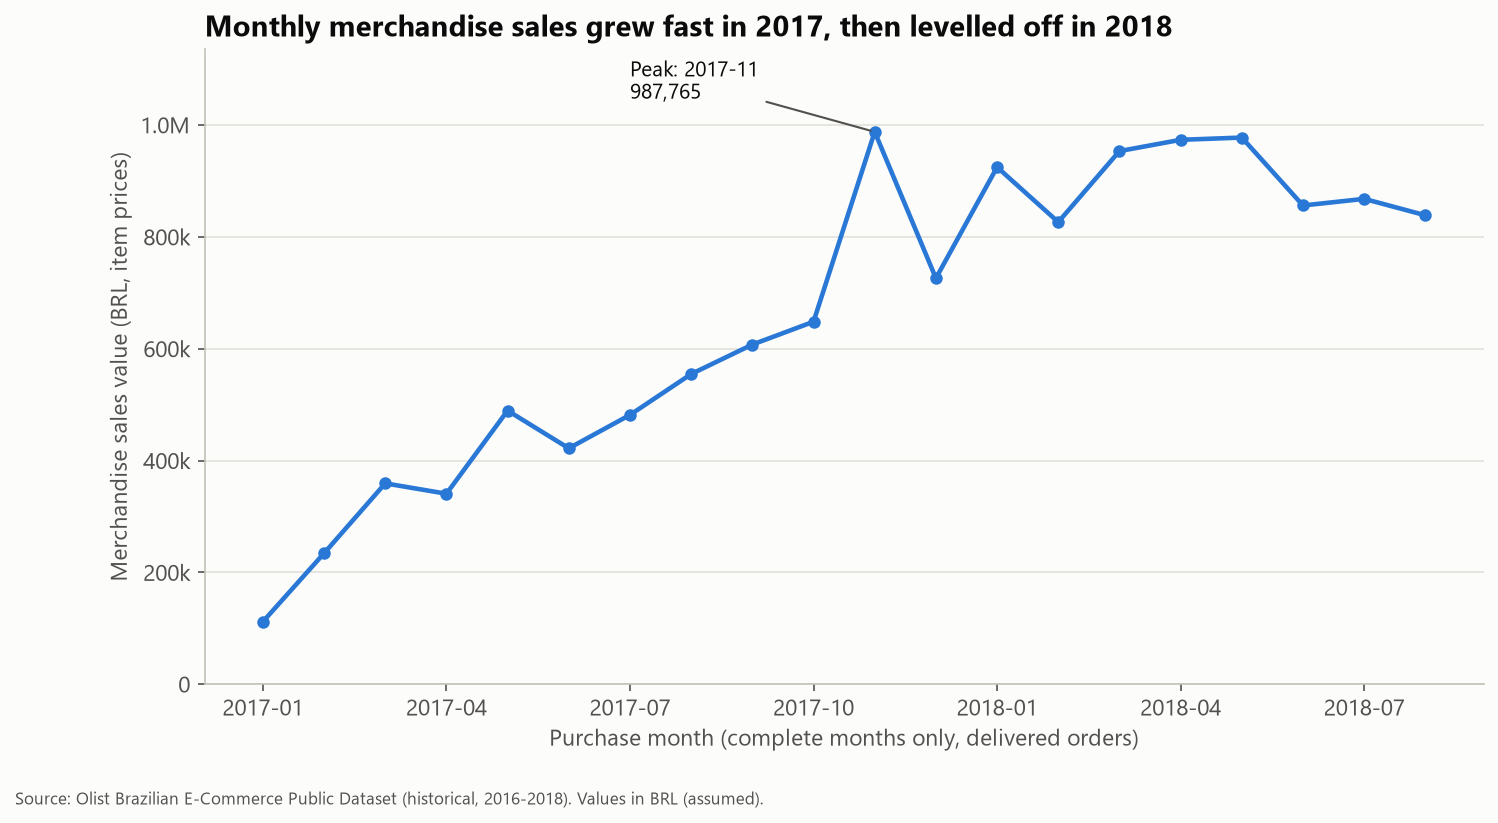
+141.1%
Year-on-year merchandise sales of delivered orders, January–August 2017 to 2018
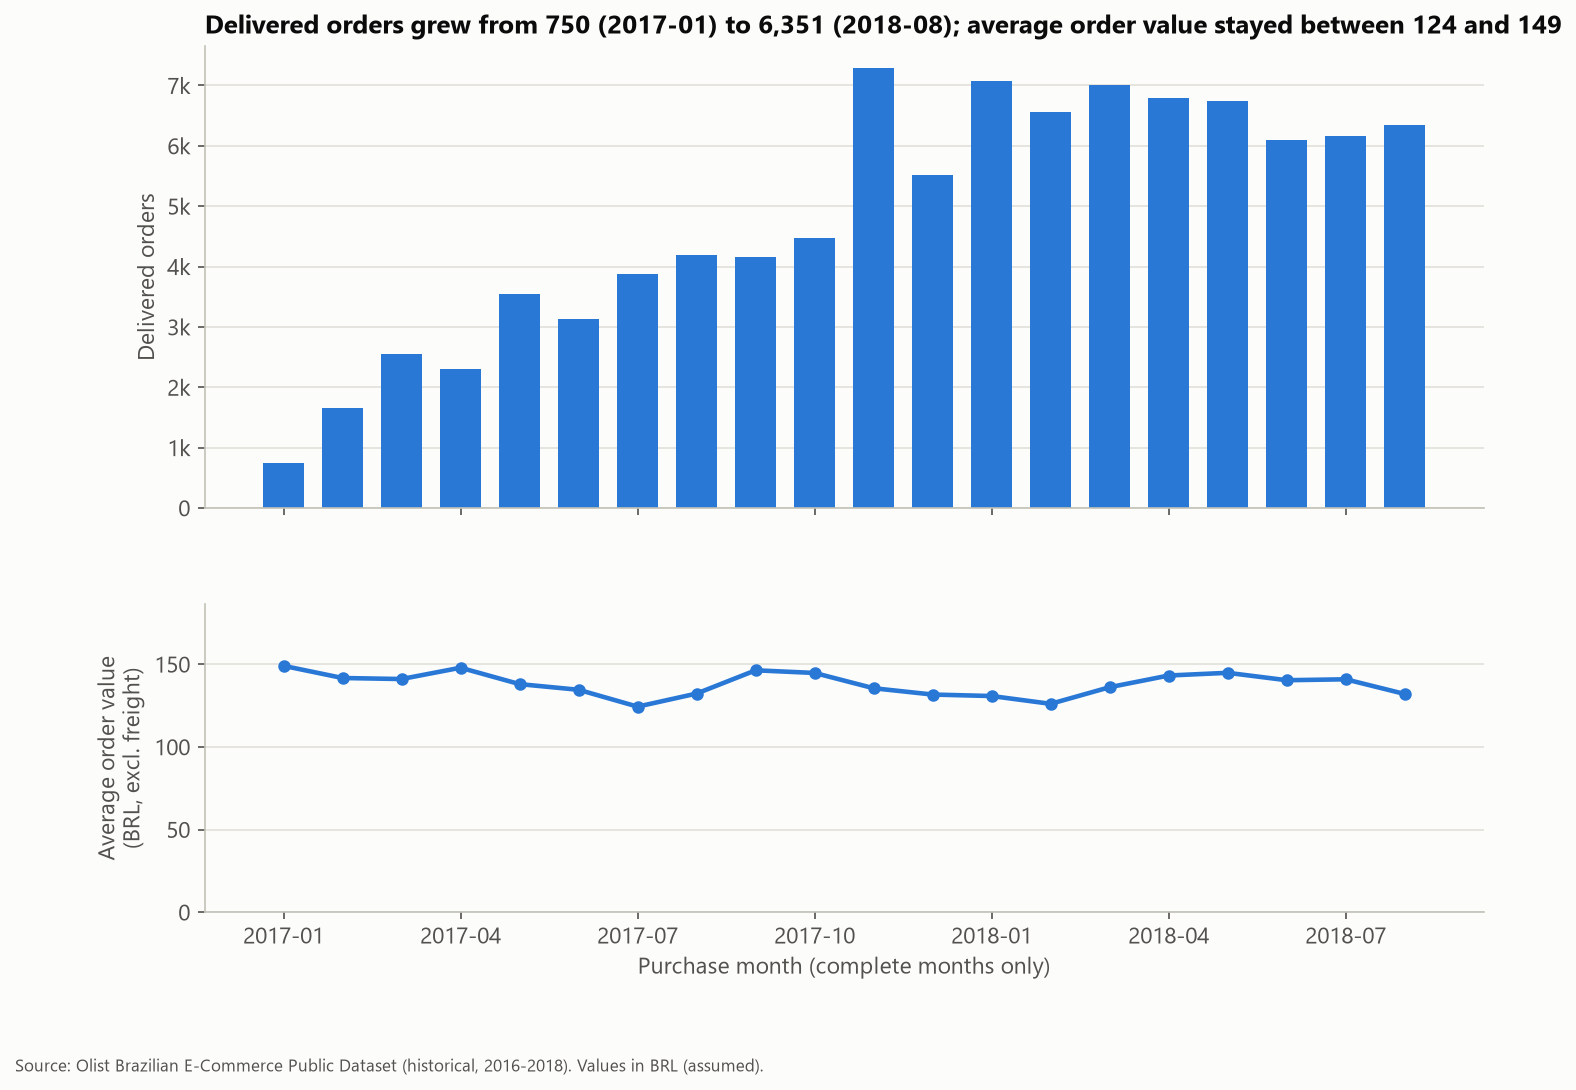
Growth came from more orders, not larger ones: average order value stayed between 124 and 149 in every complete month.
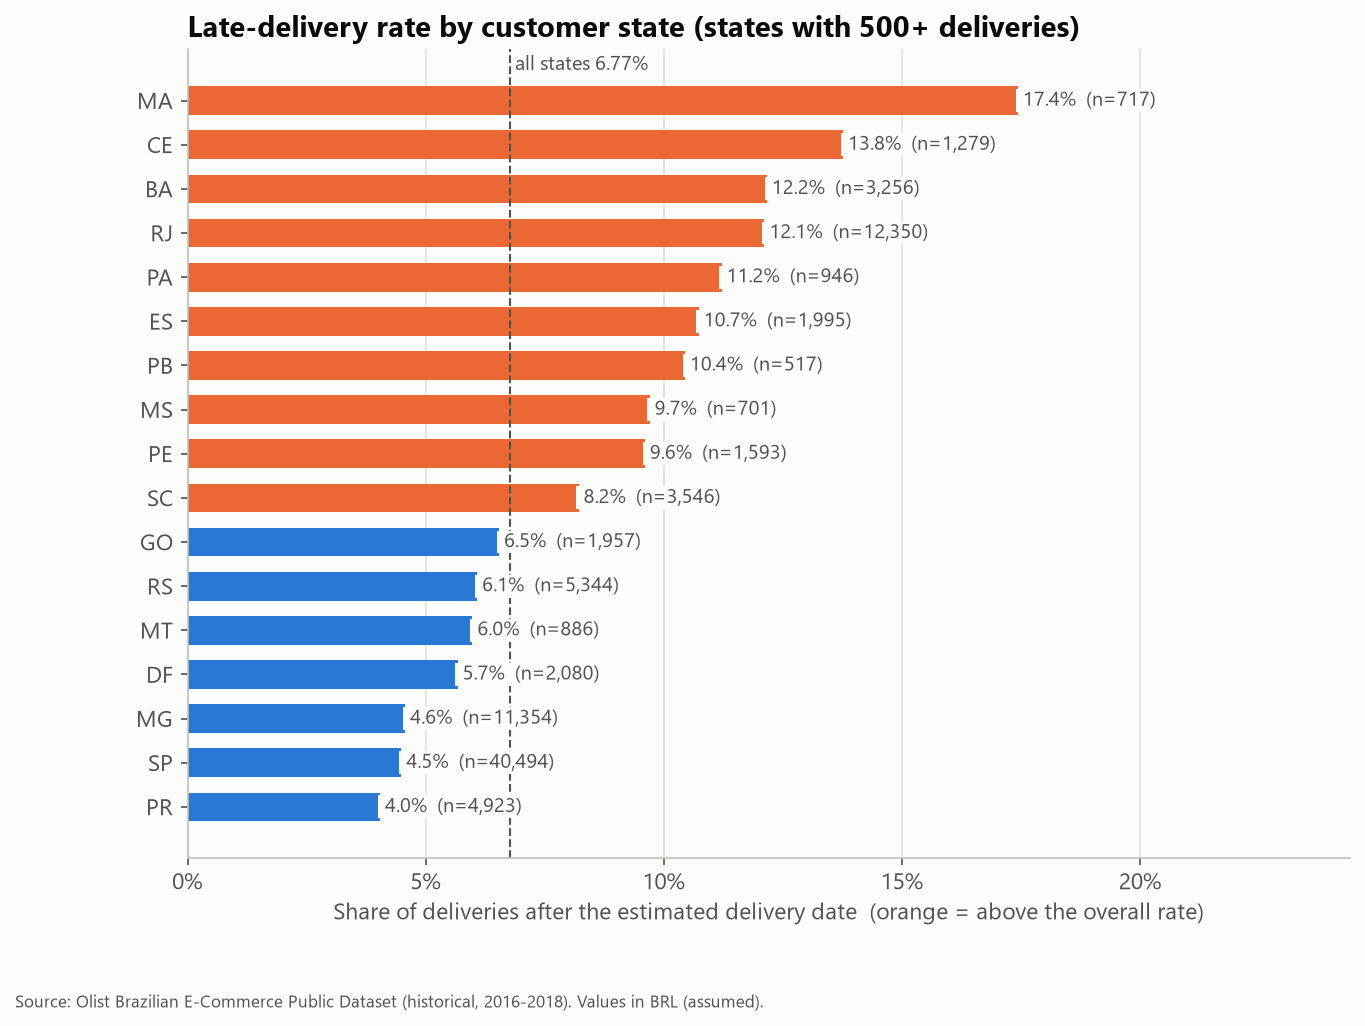
6.77%
of delivered orders arrived after the estimated date (6,534 of 96,470 with a valid delivery date)
The late rate ranged from 4.04% (PR) to 17.43% (MA) among states with 500+ deliveries.
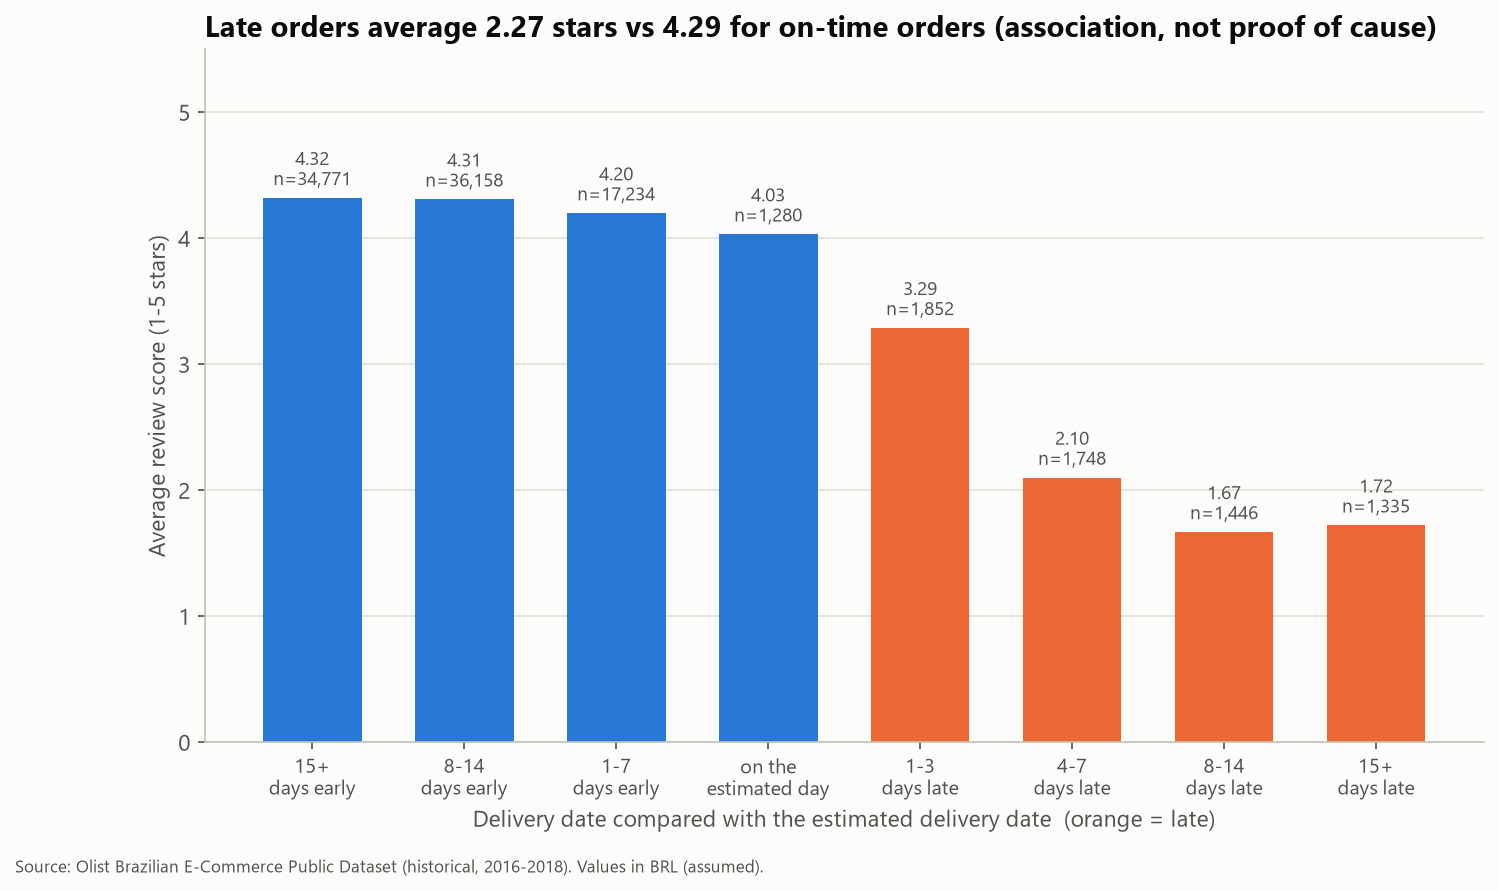
4.29 vs 2.27
Average review score, on-time vs late orders
An association, not proof of cause. The gap appears within each of the 14 states with at least 100 reviewed late orders.
3.00%
of customers placed a second delivered order in the data period
Only 1.92% came back within 180 days, and 829 of the 2,801 repeat customers ordered twice on the same day.
Charts from the analysis
 (open full size in a new tab)
 (open full size in a new tab)
More charts (4)
 (open full size in a new tab)
 (open full size in a new tab)
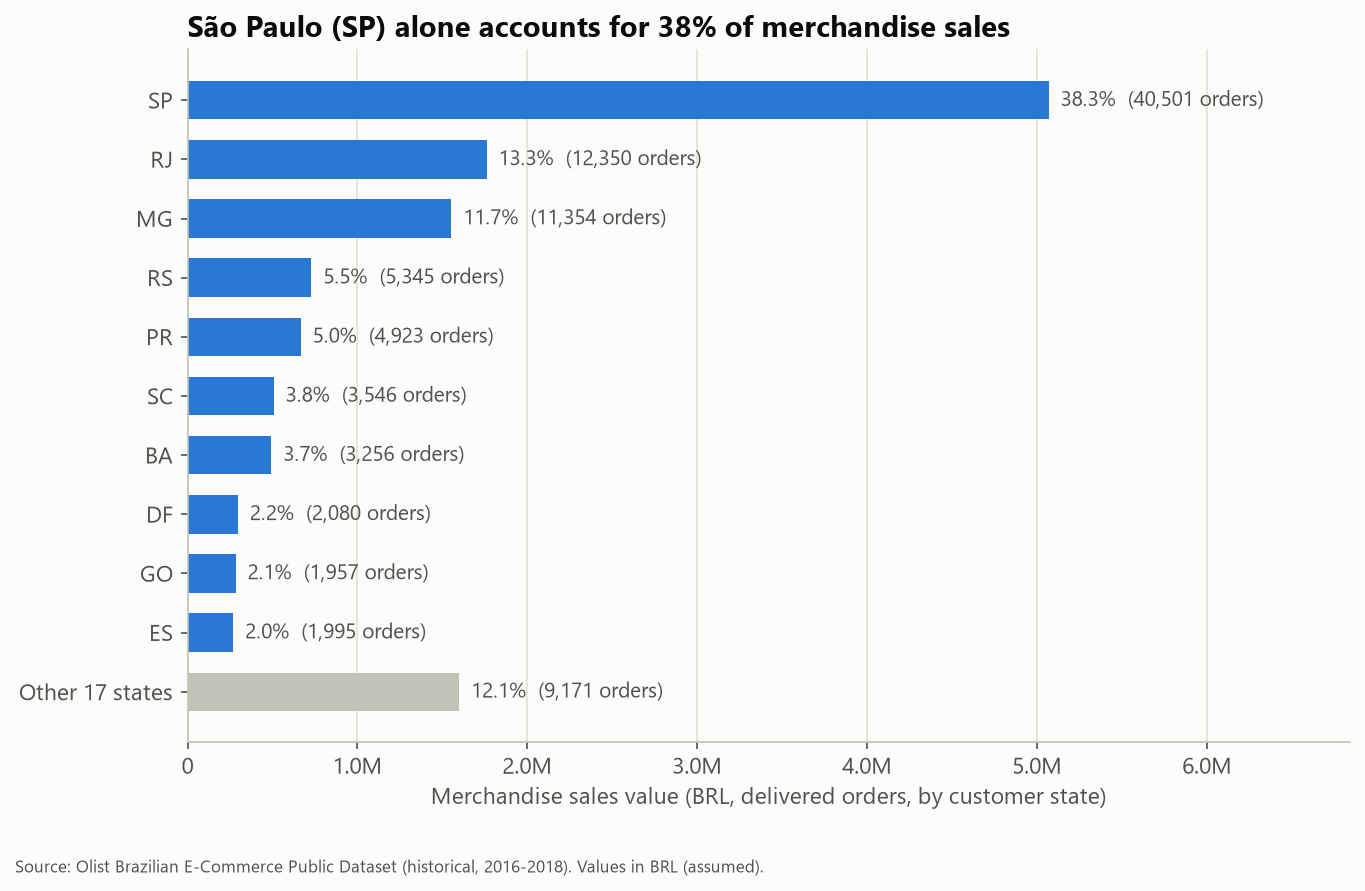 (open full size in a new tab)
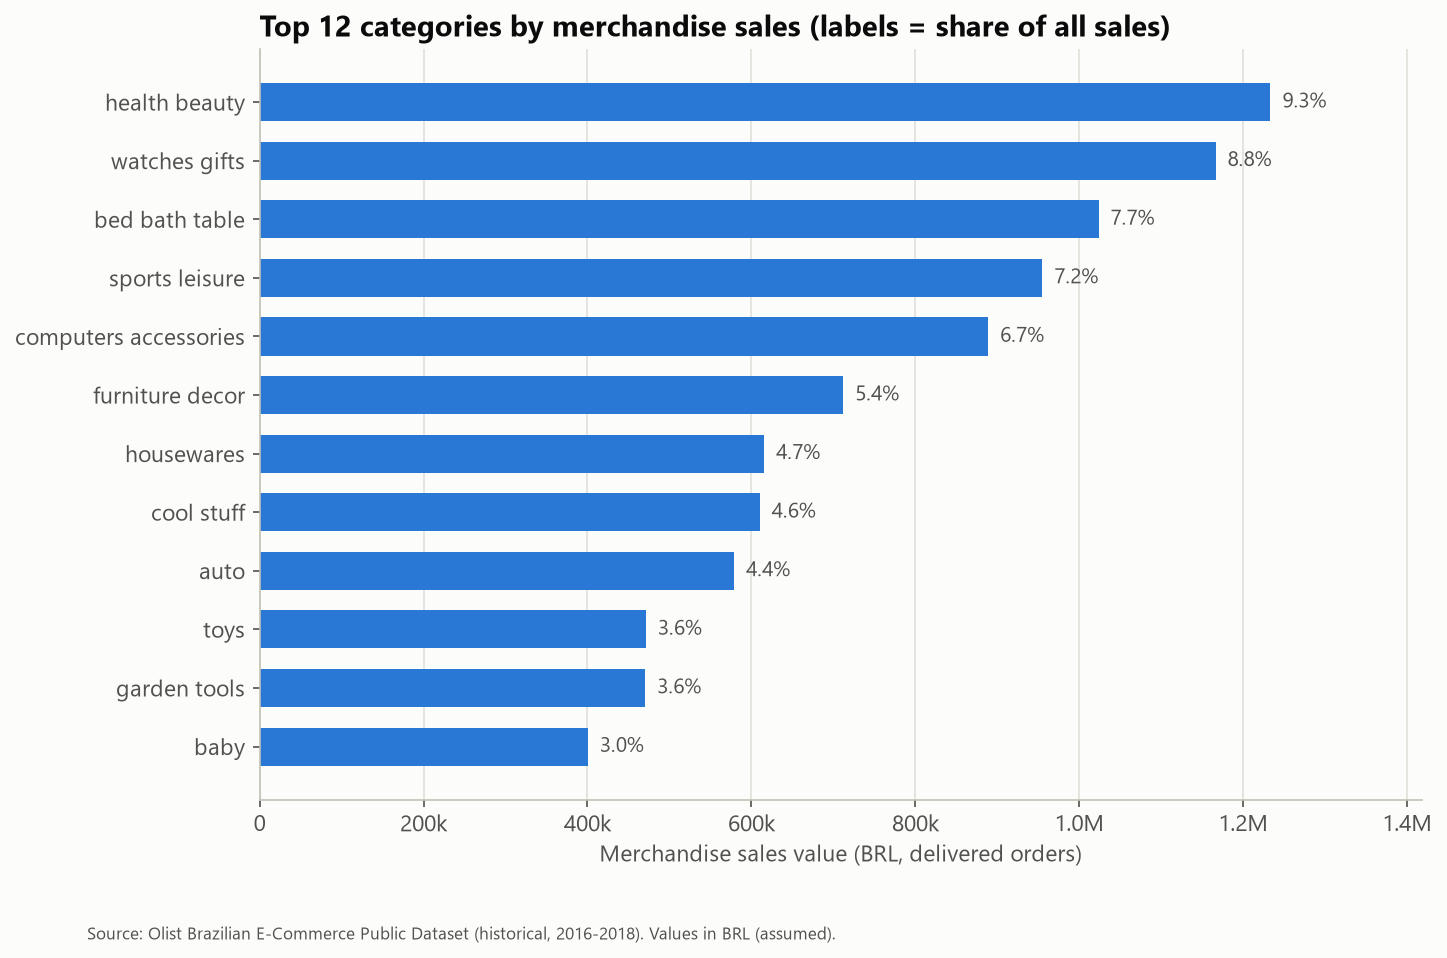 (open full size in a new tab)
Limitations
- Historical data only (2016–2018); results describe that period, not Olist today.
- Observational data, so comparisons show associations rather than causes.
- Currency is not stated in the files and is assumed to be BRL; merchandise value is not company revenue.
- 610 products (1.29% of delivered sales) have no category, and repeat purchasing is measured only inside the data window.